

Click here to read part-1 of this article.
The world is reeling under Corona crisis and every day we are hearing some devastating numbers, there is mayhem all over the globe. At the same time it is these numbers which are now providing idea regarding the growth and spread of the pandemic. I am here by providing numbers which are telling us that the relentless march of this pandemic is slowing down. The numbers are growing but it’s their speed of growth which appears to have been slowing. This is regardless of the country and region and appears independent of the type of intervention policy of any particular country. And this happens roughly after 10-12 weeks of infection. Please check figures given below, they clearly tell us that the pandemic is slowing down in its growth rate which was explosive to begin with.
Fig 1 Shows the growth rate of Corona on a log scale. It clearly shows that the pandemic is now slowing down in every region.
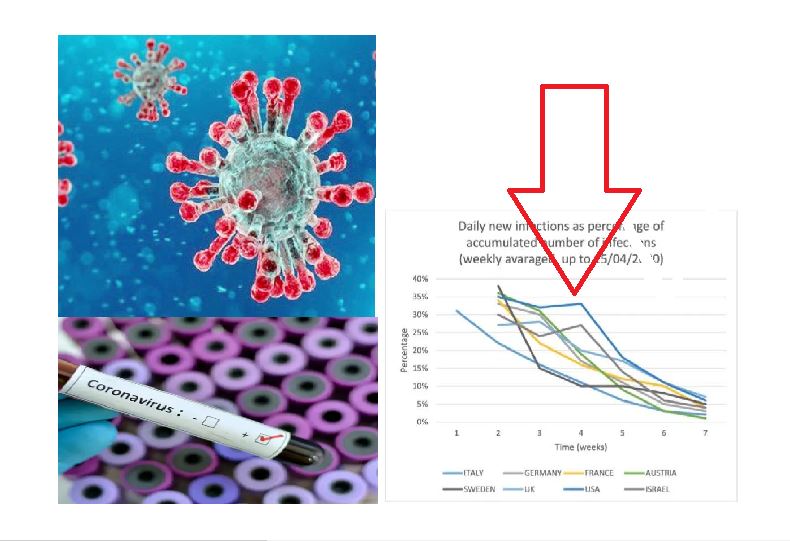
Fig 2 Shows that the number of new cases are declining as compared to the total accumulated number of cases.

Fig 1 – Corona growth on Log scale in Italy, Sweden, USA and globally
Red Line indicates the Logarithmic growth
Black Line indicates the actual number of cases over time
Blue Line indicates the Trend of New emerging cases with time
COVID-19 is the name of disease caused by Corona Virus
The Cumulative Decline

Fig 2 – The Cumulative Cases Scale in various Countries
Now the query arises how is this happening when there is no vaccine being used ? Lockdown alone cannot explain this as its happening everywhere; even in those countries which did not go for a strict lockdown, e.g., Sweden– it’s rather happening globally.
In my opinion a very important role is being played by the asymptomatic infected patients who may be helping us take a step towards herd immunity. It’s quite possible that some immunity may have started building in the hot spots.
Asymptomatic cases can be defined as those cases which have contracted the virus but have not displayed the disease. They may be in incubation period which is time taken for disease to show after contracting the virus. It is up to 14 days in COVID-19 though most show symptoms in 5-7 days.
Asymptomatic cases are also those who contract the virus but heal on their own and do not develop the disease. It is these patients who show Antibodies in their blood after the infection as proof of infection. These are the patients which are very important to know the actual spread of the disease and are the ones we will here on call as asymptomatics.
And here in comes the very important difference in Case Fatality rate or CFR and Infection Fatality Rate or IFR. If we discuss the effect of corona everywhere we see the CFR is being discussed and talked about. It is certainly important but equally, and probably even more, important is the IFR.
Now please check following figure,

Fig 3 – Understanding the difference between CFR and IFR
Thus we conclude that it is number of the Asymptomatic and largely Unknown patents which can actually tell us the real severity of the disease esp. in terms of mortality, which is biggest reason of Corona Paranoia which has taken over the world.
I now put forward to you some very interesting numbers which have mostly come in the last week. Most numbers are from USA as it is America which is doing the most number of tests.
Maharashtra, India – There has been official statement that in this state of India there are around 83% asymptomatic cases. ICMR also now predicts number of asymptomatic cases as more than 80% in India.
USS Theodore Roosevelt Incident – This is a classic hotspot case and one of the first which has been studied in great details as to what happens when this infection spreads within a contained community. Almost entire crew has now been tested and it has been found that 60% positive patients are asymptomatic.
Boston Pine Street Inn Incident – In Boston, US during their testing the clinicians realized that a cluster of the people who had come up positive was staying at Boston’s Pine Street Inn which is a shelter home. So the state made testing kits available, and just over a week ago, Health Care for the Homeless tested everyone coming into that shelter.
The results? Out of 397 people tested, 146 (36%) came up positive. But even more surprising, they weren’t showing any signs of sickness.
The Los Angeles County Case – In a drive to detect infected asymptomatic patients around 4.1% of adults tested positive for corona virus antibodies in a study of Los Angeles County residents suggesting that the rate of infection may be 40 times higher than the number of confirmed cases. This number is so high that US has officially stated that they might have to recalibrate disease prediction models.
New York-Presbyterian/Columbia University Irving Medical Center Study – This was a study done in New York in women who visited for delivery. The published findings found that, about 15 percent of patients who came for delivery tested positive for the corona virus, but around 88 percent of these women had no symptoms of infection.
Santa Clara County Case – This study was conducted by Stanford University to find out the actual prevalence of the disease by testing in a known area of community spread. The antibody tests were used to see how much of the population has contacted corona. The researchers noted that Covid-19 could be far more widespread than the official counts suggest. Specifically, they estimate that between 2.5% and 4.2% of people in Santa Clara County may have antibodies. The range is a result of different models used to extrapolate the test results to a representative population.
This estimates Corona prevalence to be 50 to 85 times more than the number of confirmed cases. And this is big enough to change the policies they noted.
Given the study’s estimate also suggest that the IFR or Infection Fatality Rate is between 0.12% and 0.2% and that’s a far contrast from the county’s mortality rate, or CFR, based on official cases and deaths which is 3.9%.
Conclusion: Thus it can be clearly seen that the advent of new methods of testing are helping us identify the true load of corona in the society. The number of asymptomatic cases is far more than was earlier thought. This can be seen as a double edged sword and can be actually taken up in two ways.
1. The Pessimistic View –
a. That such a large number of asymptomatic cases are going to further fuel the fire of corona and make community spread worse.
b. This is of course a big challenge to the planners as they will have to think of more effective ways and new models.
2. The optimistic View –
a. This also means that we are already moving towards Herd immunity and taking baby steps in that direction. We know that we need a certain number of people, 60-80% as per various infectivity models to acquire herd immunity against SARS-Cov-2. These asymptomatics are the people who are helping us achieve that figure.
b. It also means that Infection Fatality Rate of Corona infection is much lower than the Case Fatality rate and this is a very good news.
This pandemic is providing us massive amount of data daily. My effort here is to make it easier to understand it for everyone.
Credits: Times of Israel and several other news portals, press conferences of various agencies and open source material.
Author can be contacted at: kapil.paliwal@yahoo.co.in, http://www.paliwaleye.webs.com , http://www.paliwaleyeandear.com

Leave a Reply